
Colour-coding explainer
Here’s the introduction to my colour-coding system that I originally wrote for Stockopedia, but remains the same here on my substack.
Explanatory notes -
A quick reminder that we don’t recommend any shares. We aim to review trading updates & results of the day and offer our opinions on them as possible candidates for further research if they interest you. Our opinions will sometimes turn out to be right, and sometimes wrong, because it's anybody's guess what direction market sentiment will take & nobody can predict the future with certainty. We are analysing the company fundamentals, not trying to predict market sentiment or share price movements.
We stick to companies that have issued news on the day, with market caps (usually) between £10m and £1bn. We usually avoid the smallest, and most speculative companies, and also avoid a few specialist sectors (e.g. natural resources, pharma/biotech, investment cos, insurance). Although if something is newsworthy and interesting, we'll try to comment on it. Please bear in mind the list of companies reporting is not a guarantee that we’ll write about everything on the list. We typically cover c.5 companies per day, with a particular emphasis on under/over expectations updates. Obviously with the resources available, we can't cover everything! Add you own comments if you see something interesting, and feel free to discuss anything shares-related in the comments.
A key assumption is that readers DYOR (do your own research), and make your own investment decisions. Reader comments are welcomed - please be civil, rational, and include the company name/ticker, otherwise people won't necessarily know what company you are referring to.
What does our colour-coding mean?
Will it guarantee instant, easy riches? Sadly not! Share prices move up or down for many reasons, and can often detach from the company fundamentals. So we're not making any predictions about what share prices will do.
In a 9-month study here, the results were strikingly good - covering a sample of 770 sections over a 7-month period (July 2023 to Feb 2024), using live prices at 15/1/2025 (the time of writing) this was the result -
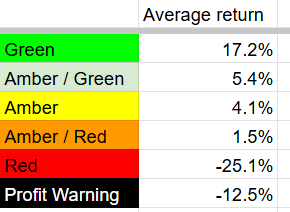
So over time, it does seem to work.
Green
Means in our opinion, a company is well-financed (so low risk of dilution/insolvency), is trading well, and has a reasonably good outlook, and shares look reasonably priced. And/or it's such deep value that we see a good chance of a turnaround, and think that the share price might have overshot on the downside.
Amber/Green
In between amber & green, so we’re moderately positive.
Amber
Means we don't have a strong view either way, and can see some positives, and some negatives. Often companies like this are good, but expensive.
Amber/Red
In between amber and red - so we see higher risk, eg from excessive debt, but problems are not as serious as for red. Intriguingly, amber/red shares can sometimes deliver spectacular turnarounds, so sometimes this risk is worth taking - you have to make that decision, we’re just flagging that something is higher risk.
Red
Means we see significant, or serious problems, so anyone looking at the share needs to be aware of the high risk. Sometimes risky shares can produce high returns, if they survive/recover. So again, we're not saying the share price will necessarily under-perform, we're just flagging the high risk.
Others: PINK = takeover approach, BLACK = profit warning, GREY = possible de-listing